


National healthcare spending now exceeds 17% of U.S. GDP, and employer-sponsored plans are absorbing a growing share. But the real challenge isn’t broad utilization, it’s concentration. A small number of high-cost members are driving an outsized portion of total plan spend.
- The number of employers likely to experience a stop-loss claim in any given benefit year remains consistent at 88% looking at data over benefit years 2020-2023. (Sun Life)
- Overall, $1M+ claims are on the rise, increasing by 29% this year when looking at claims-per-million-covered-employees, and are up 61% over the last four years. (Sun Life)
- The number of claims over $3M is steadily rising. In 2024, Sun Life had 47 claims in this category versus 32 in 2023.
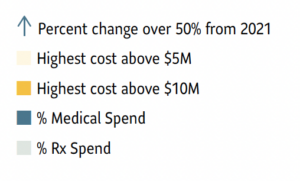
- 10 claims reached more than $5M, with two claims over $10M, and a historic highest claim of $12.7M. (Sun Life)
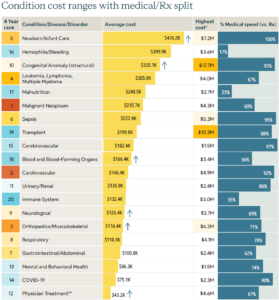
The Same Conditions, at Much Higher Price Tags
The clinical drivers haven’t changed dramatically. What has changed is the cost per case.
| Condition | Notable Trend |
| Cancer | Drugs for cancer treatment make up 80% of the top 10 highest-cost drugs |
| Musculoskeletal (MSK) | Average cost reached $116,400 in 2024, up 14% year-over-year |
| Congenital Anomaly | Average cost surged 70% to $355,100 in 2024 |
| Transplants | Consistently among the highest-cost categories, with claims exceeding $7M |
| Premature/Complex Newborns | Among the most severe and costly cases in employer plans |
Average costs for top high-cost conditions have increased 30–40% since 2021, and that trend is expected to continue.
Pharmacy Is Now a Stop-Loss Issue
- Specialty pharmacy has become one of the most significant contributors to catastrophic claims and it’s directly tied to stop-loss outcomes.
- Pharmacy now represents 20–30% of total healthcare costs, up from 10–15% a decade ago.
- Specialty drugs account for less than 2% of prescriptions but over 50% of total drug spend.
- Many specialty therapies carry annual costs of $150,000–$300,000+ per patient.
- Employers should expect a median ~11–12% pharmacy cost increases heading into 2026 (Business Group on Health).
Pharmacy strategy and stop-loss strategy are no longer separate conversations — they must be managed together.
As the chart below shows (Sun Life), pharmacy strategy and stop-loss strategy are no longer separate conversations, they must be managed together as costs continue to increase and pharmacy takes up a bigger piece of total spend.
What to Expect at Renewal
Stop-loss carriers are responding to higher severity and ongoing volatility with:
- Premium increases in the high-single to double-digit range
- Greater underwriting scrutiny, including deeper claim reviews and increased use of lasers
- More focus on contract terms — exclusions, reimbursement definitions, and ongoing claim limitations that shape your true financial exposure
What How Seubert Can Help
At Seubert & Associates, Inc. we take a strategic, proactive approach to stop-loss, one designed to minimize your risk exposure and maximize the long-term performance of your benefits program.
Here’s how we help:
- Stop-Loss as a Diagnostic Tool — We analyze your stop-loss data to identify where risk lives, so targeted interventions can be deployed before costs escalate.
- Integrated Pharmacy & Stop-Loss Strategy — With pharmacy growing at 11–12% annually, we help align your PBM strategy with your stop-loss structure to reduce catastrophic exposure.
- Shock-Claim Mitigation — We connect clients with specialty care platforms, care navigation programs, chronic condition management, and oncology solutions that reduce both the frequency and severity of large claims.
- Contract Review & Optimization — We scrutinize the terms, definitions, exclusions, and reimbursement language that often determine your real financial outcome, not just the base rate.
- Renewal Preparation — We help you build a compelling narrative around large claims, risk controls, and mitigation strategies to achieve the most competitive renewal positioning possible.
The bottom line: Stop-loss hasn’t become more expensive by accident. It reflects a healthcare environment where high-cost cases are more frequent, treatments are more advanced, and volatility is the new normal. The right advisor makes all the difference in how well your organization is protected and positioned for what comes next. Contact Seubert & Associates today to discuss how we can help you build a smarter, more resilient benefits strategy. Let’s get ahead of the risk together.
Sources
CMS National Health Expenditure Data. Centers for Medicare & Medicaid Services, national health spending data and projections, 2024.
KFF Employer Health Benefits Survey. Kaiser Family Foundation survey data, 2025 (most current), with prior year comparison from 2024.
CDC Chronic Disease Data and Cost Impact. Centers for Disease Control and Prevention population health statistics and economic burden data, 2024.
FDA Novel Drug and Biologic Approvals Data. U.S. Food and Drug Administration new molecular entity (NME) and biologic approval data, 2024.
IQVIA Institute U.S. Medicine Spending and Utilization Reports. IQVIA Institute proprietary industry data and forecasts, 2025.
Sun Life’s 2025 High-Cost Claims and Injectable Drug Trends Report. Sun Life book of business data including first-dollar claims and stop-loss reimbursements, 2024. Rank of conditions is from four year view, 2021-2024.”

Contact Michael to see how you could minimize risk.
Michael Stevenson | 412.498.6292 | [email protected] | LinkedIn
- |
- |
- |
- |